But how can you measure it?
Once upon a time, pricing for home internet usage was the major differentiator. Then came speed. Then came bundling of services.
“Get ‘em, lock ‘em in, and bill ‘em,” was the credo.
But as time went on, subscribers decided that they didn’t want to be locked in. Pricing, speed, service packages were changing so fast that subscribers began to suffer severe cases of FOMO – fear of missing out. No sooner did you sign up with ISP X then ISP Y offered more bandwidth for less or bundled in TV service and you would be stuck for another year or two without.
Today, we can safely say that virtually all homes are connected, that the internet works reasonably well most of the time, and that the monthly price is about the same.
In a world of highly equivalent offerings and pricing, how can an Internet Service Provider know if its subscribers are happy or miserable, loyal, or about to churn? How can ISP X compare the state of its subscriber community to ISP Y’s?
Why limit these questions to ISPs? Today, we consume services and apps from thousands of players, large and small. Dozens of connected devices are part of our lives, too.
Stakeholders across the entire internet service delivery chain wonder how they can measure satisfaction with their share of the burgeoning connected-home market.

Internet Service Delivery Chain
How can Netflix know if it is satisfying subscriber needs better than competitor Hulu? Does Zoom work better than Google Meet? Which gaming service do players like more: Nvidia GeForce Now, PlayStation Now, or Fortnite? Is Google Assist fulfilling needs better than Alexa or Siri? Is LG’s smart TV better than Samsung’s or Sony’s in the eyes of users?
What’s the big differentiator? It’s all about Customer Experience (CX). Subscribers will remain loyal to the internet service providers, app creators, and connected-device manufacturers that consistently deliver to them the experience they desire.
How can you measure CX? How can Netflix, Hulu, Zoom, Google, Nvidia, Sony, Fortnite, Amazon, Apple, LG, or Samsung quantify the enjoyment that their customers/subscribers are having with their devices and services? How can Verizon compare itself to Xfinity as a deliverer of internet service to the connected home?
Veego has the answer!
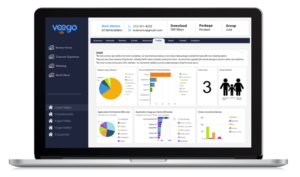
Veego continuously monitors and measures the overall health of the connected home as well as every connected device and consumed service and app. At any moment, ISPs, app creators, device manufacturers, and media services can know their score. They can measure any house, region, or other segment of choice not only to drill down into the scores, but to discover the reasons behind those scores. Is Netflix notoriously slow in a certain town? Are LG TV’s experiencing too much buffering after 9 PM? Is there too much lag from certain Nvidia game servers?
These and thousands of other questions can now be answered quickly and precisely at any moment for immediate analysis or collected historically for comprehensive, long-term research.


Valuable Insights Displayed on the Veego Dashboard
Without having to rely on Customer Support for statistics, Customer Experience Departments finally have the quantification of CX that they crave right at their fingertips. They can quickly segment households having CX problems. They can spot usage trends, identify important events that impede satisfaction, and know how subscribers are faring, user by user, house by house, region by region, device by device, service by service, and more.
Operations Departments can easily slice and dice their user communities—using accurate information—to know how their internet delivery, devices, or services are performing.
Marketing Departments can discover how to personalize the CX for each and every user and know when to contact subscribers with upsell and cross-sell opportunities. They can also identify the factors that lead to churn and circumvent them in time.
CX is indeed the way to understand subscribers and Veego delivers the knowledge.


